Session 1 · TRACE: Accounts
Midnight in Kaikōura
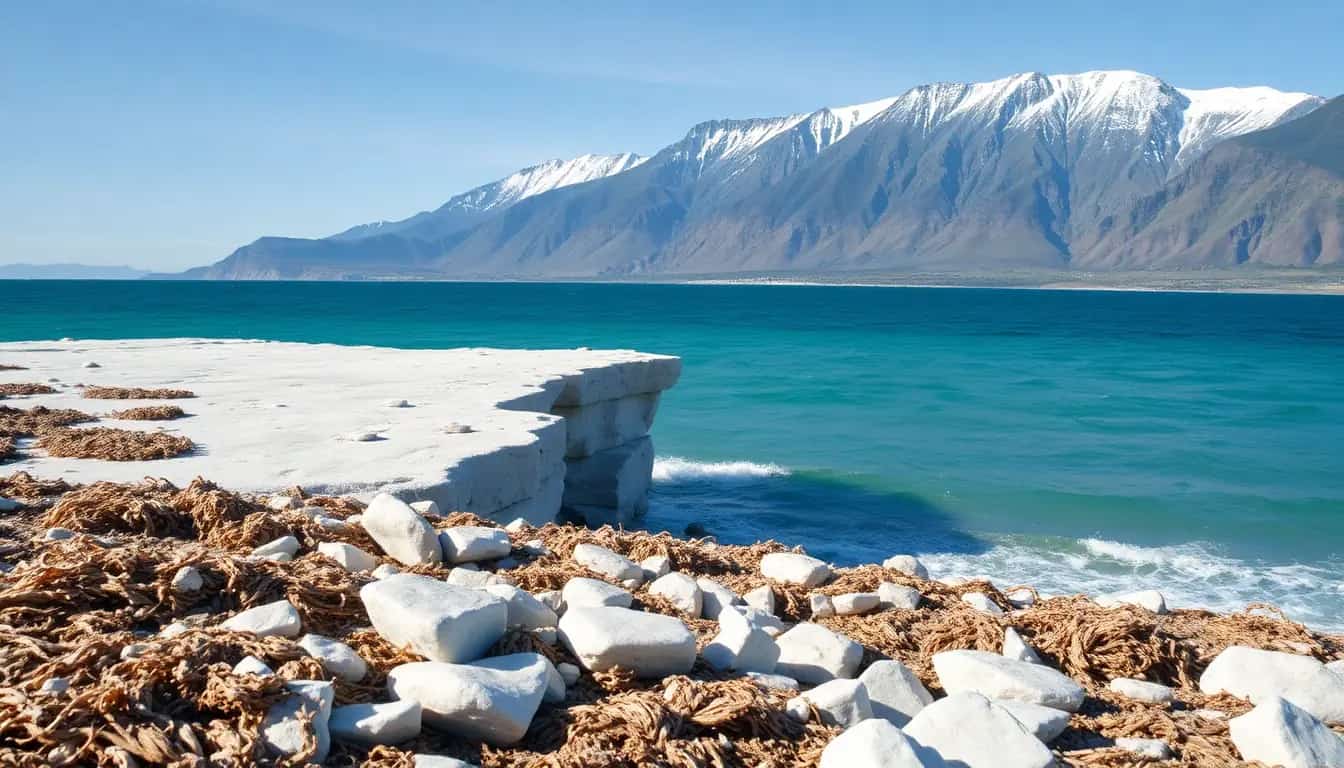
- 10 minTimeline: 14 November 2016, just after midnight, a magnitude 7.8 earthquake. Look at the NASA image of the Kaikōura coast. What changed?
- 20 minSource stations: a GeoNet science story, a Science Learning Hub article, a map of State Highway 1 closures, and a short resident account. Record who wrote each one, when and why.
- 15 minGraph it: plot GeoNet aftershock numbers by week for the first two months. What does the shape of the graph tell you?
- 5 minExit card: one fact, one feeling and one question from today's sources.
Session 2 · TRACE: Accounts
Two accounts that do not agree
- 10 minWhy do two people remember the same event differently? Think of a school event you and a friend remember differently.
- 25 minCompare two accounts of Cyclone Gabrielle in the Esk Valley: a NIWA science article and a news story from residents. What does each notice? What does each leave out? Where do they agree?
- 10 minCorroborate: find one fact that both sources support, and one claim you would need a third source to check.
- 5 minAdd your best sources to the class evidence wall with a one-line note on how reliable each one is.
Getting started
Use the source-detective card: Who made it? When? Why? What can it tell us? What can't it tell us?
Stretch
Use a GeoNet 'felt reports' map to compare how strongly the Kaikōura earthquake was felt in Wellington and Christchurch.
Checkpoint
Each group can name two different kinds of source and explain one strength and one limit of each.
Activities for this week
- Source detectives: two accounts of the same event: How can two honest sources tell different stories about the same hazard?
Useful this week
- Kaikōura earthquake ↗ What happened in 2016: faults, uplift, landslides and the small tsunami.
- M7.8 Kaikōura earthquake story ↗ The monitoring agency's own account, with maps and data.
- Christchurch earthquake kills 185 ↗ A short, careful account of 22 February 2011 and what followed.