Mathematics and Statistics · Years 7–8 · SOLVE
Think like a mathematician and statistician
Find the pattern, prove it, and predict what comes next.
Choose your inquiry
The whole class works on the same inquiry, in any term. Over two years you do both.
- Inquiry A · about 4 weeksWhat the Data ShowsYour class has a real dataset — sports results, weather, survey responses, or school habits. Numbers tell a story, but only if you ask the right questions and check whether conclusions are fair.You'll make: A statistical investigation report with graphs, summary, and justified conclusions for a class data exhibition.Open this inquiry →
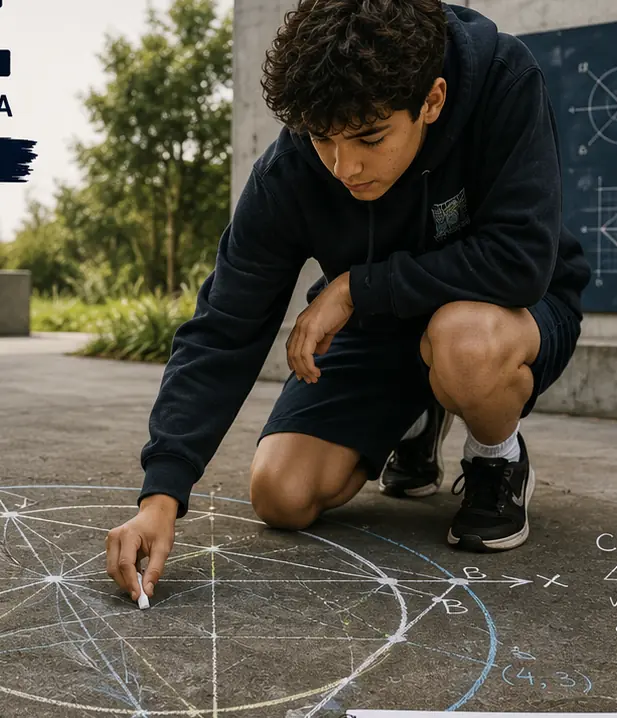
- Inquiry B · about 5 weeksPatterns, Proof and PredictionA pattern in your world — growth rates, game statistics, or spatial relationships — might be coincidence or might be real. You will generalise, justify, and test predictions.You'll make: A reasoning showcase with generalised rule, evidence, and tested prediction.Open this inquiry →
Your journey: SOLVE
Every Mathematics and Statistics inquiry moves through the same stages.
- Stage 1: See the Pattern
- Stage 2: Organise Information
- Stage 3: Link Ideas
- Stage 4: Verify
- Stage 5: Explain
Explore more
Trusted New Zealand sites to use alongside your inquiry.
- CensusAtSchool ↗
CensusAtSchool NZ
Real survey data from NZ students to investigate.
- NZ Maths ↗
NZ Maths
Maths problems and activities for NZ classrooms.
- Stats NZ ↗
Tatauranga Aotearoa
Official New Zealand data on people, places and the economy.
Topics
- statistical investigation
- data and graphs
- patterns and algebra
- generalising
- prediction
- reasoning
Ready to run it with your class?
Free trial for NZ schools. One combined Years 7–8 class, any term.