Session 1 · VOICE: Investigate
Insulation fair test
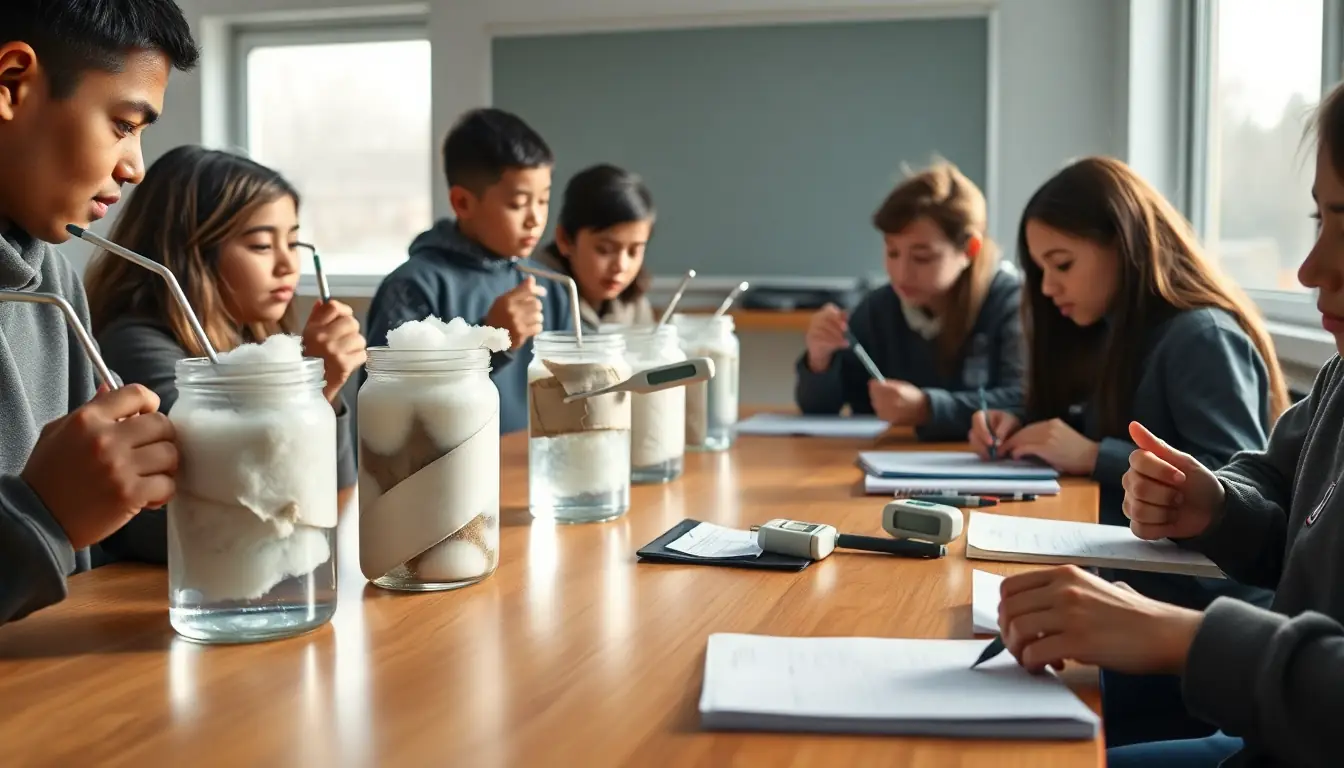
- 10 minSet up jars, wraps and thermometers. Teacher pours hot tap water to the same line in every jar.
- 30 minTake readings every 5 minutes. Roles: timer, reader, recorder, checker. Note anything that went wrong.
- 10 minCalculate the drop in temperature for each material. Put the class results on one big table.
Session 2 · VOICE: Investigate
Why does water break the rules?
- 10 minLook at two bottles filled with water yesterday: one kept in the fridge, one in the freezer (lid off, filled to a marked line). What happened to the level?
- 15 minFloat an ice cube in water and one in cooking oil. Record where each sits. Most solids are denser than their liquid; water is unusual.
- 15 minGraph the class insulation results as line graphs: temperature against time, one line per material.
- 10 minDiscuss: what do trapped air and wool have in common? Link to the particle model.
Getting started
Use a graph template with the axes and scale already drawn.
Stretch
Calculate the mean drop for each material across all groups and the range, then say which result you trust most and why.
Checkpoint
The class has a shared data table and graph for every material, with the control included.
Activities for this week
- Wrap it up: the insulation fair test: Which everyday material best keeps a jar of water warm?
Useful this week
- Energy Forms and Changes ↗ Watch heat flow between blocks of iron, brick and water.
- Kitchen science ↗ Everyday kitchen investigations into mixing, heating and changing materials.