
Social Sciences · World 4 of 8 · Years 7–8
Why We Move: Migration and Belonging
Every family in Aotearoa arrived from somewhere, some 800 years ago and some last year. Map the journeys that made your place.
Big question: Why do people move to, from and within Aotearoa, and how do they change the places they arrive in?
- You'll make
- A mapped account of one neighbourhood: a flow map of where its people came from, a choropleth map of how it has grown or shrunk, recorded stories from people who moved there, and a display or digital story showing how migration changed both the people and the place.
- For
- Your local museum, library or heritage group, the people you interviewed and their whānau, and your council's community or welcoming communities team
- Time
- 5 weeks · 2 sessions a week
Your mission
Why it matters
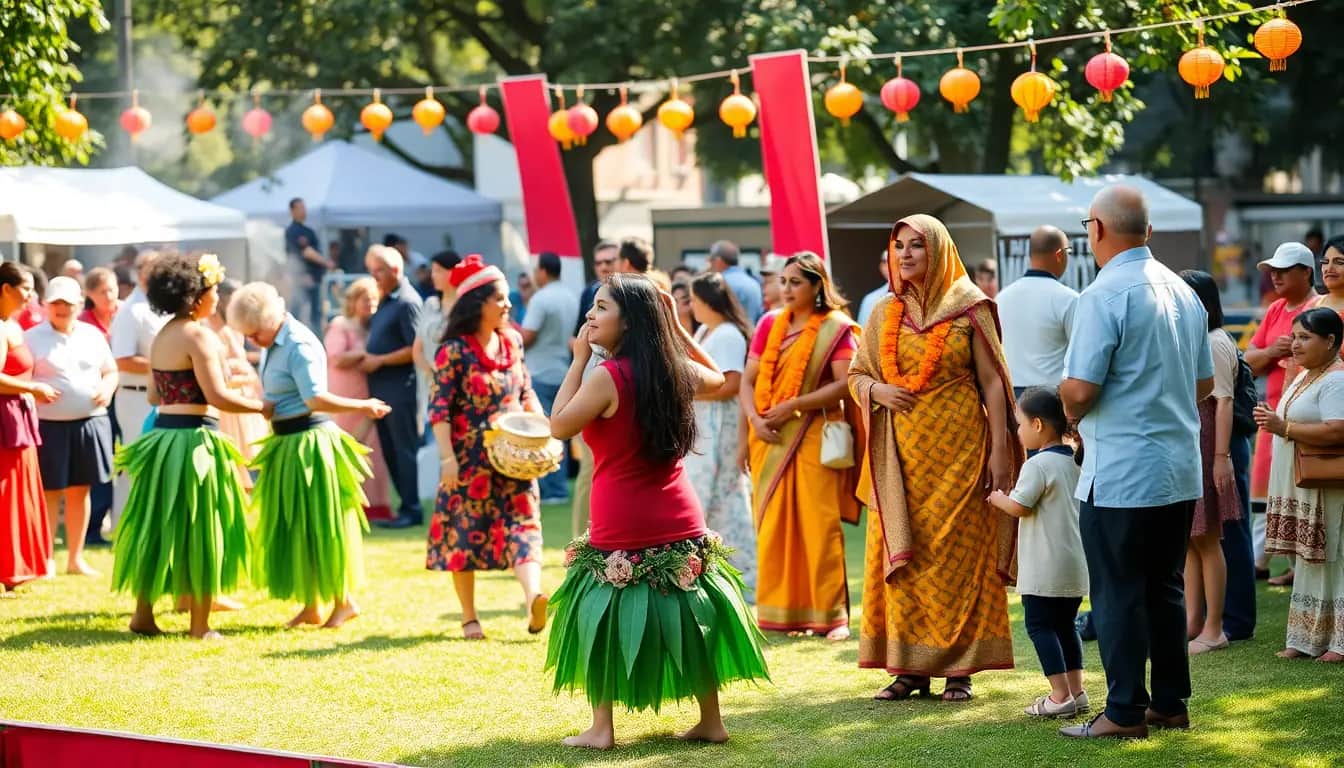
Walk down the main street of almost any New Zealand town and you can read its migration story: a Chinese market garden family's fruit shop, a Samoan church, a Dutch bakery, an Indian grocer, a marae in the city built by whānau who moved from the country. Your local museum, library or council wants a mapped account of how migration has changed one neighbourhood. You will collect stories and data, build flow and choropleth maps, and show what moving meant for the people and for the place.
More than one in four people living in New Zealand today were born overseas, and most Māori now live in towns and cities that their grandparents moved to. Migration shapes who your classmates are, the food you eat, the languages you hear and the jobs people do. Understanding why people move, what helps them belong and what gets in their way helps you be a better neighbour, and helps you understand arguments about migration you will hear all your life.

Your first step
Think of one move someone in your life has made: to a new country, a new town, a new house or from the country to a city. Write down one reason they left and one reason they chose where they went.
Make it yours
Choose a context
Same big question, three different places to explore it. Pick the one that fits your class and community.
A river town: Whanganui or your own town
Map how migration has shaped a provincial town: the 1840s New Zealand Company settlers who arrived on land already home to Whanganui iwi, post-war British and Dutch assisted migrants, Māori whānau moving from river settlements into town, and newer Pacific, Filipino and Indian families. Use Stats NZ data to find out whether each suburb is growing or shrinking, and why.
A big-city suburb: South Auckland
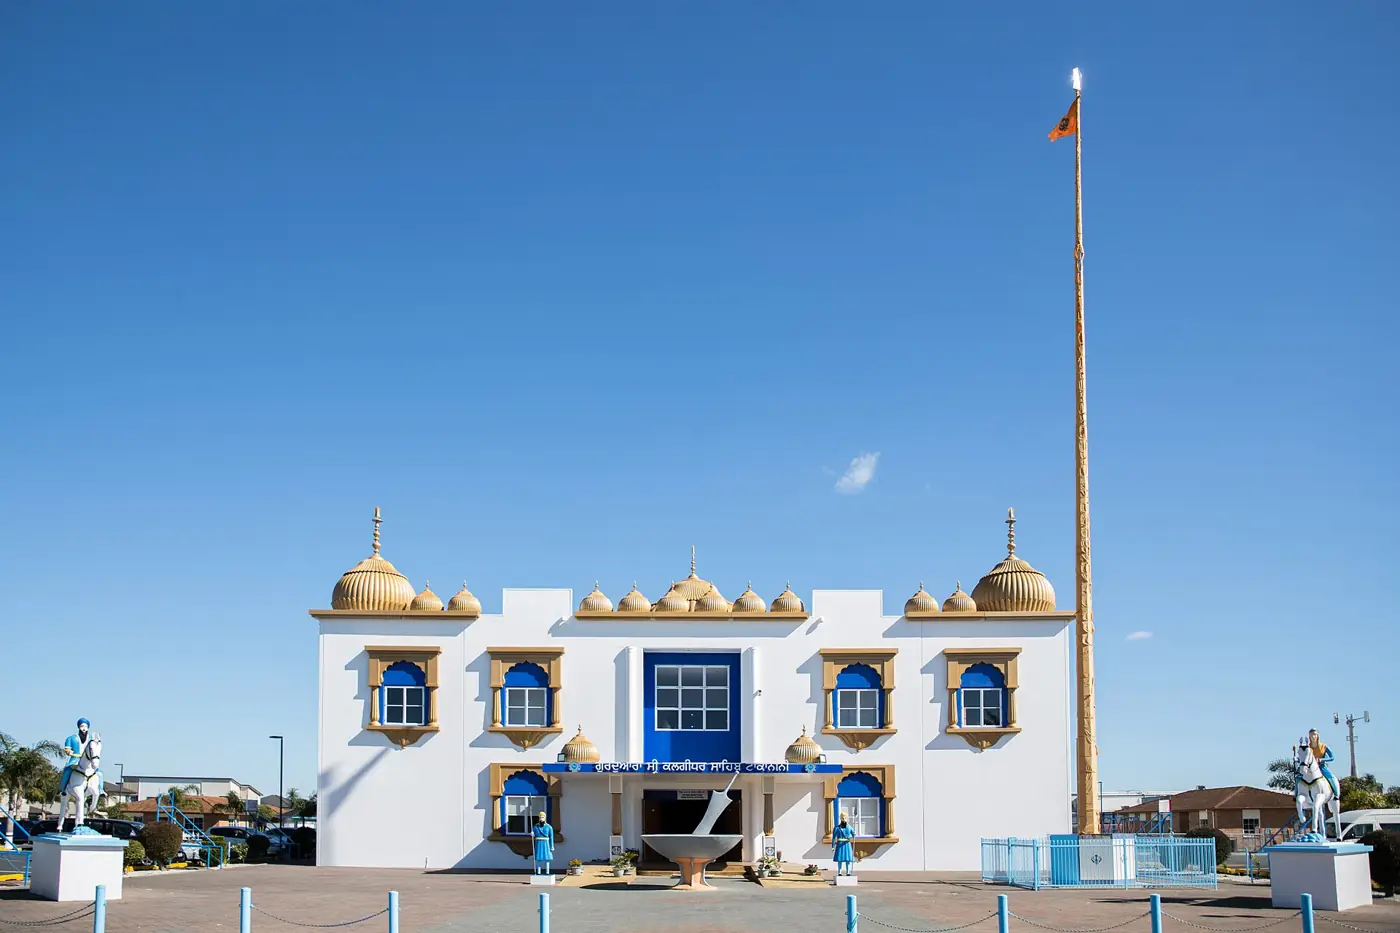
Ōtāhuhu, Māngere, Papatoetoe or Takanini: suburbs shaped by Pacific migration from the 1950s–70s and by Indian, Sikh, Chinese and Filipino communities since the 1980s. Study churches, gurdwaras, markets and shops, how community networks helped people settle, and honest history such as the Dawn Raids.
A rural community that grew or emptied
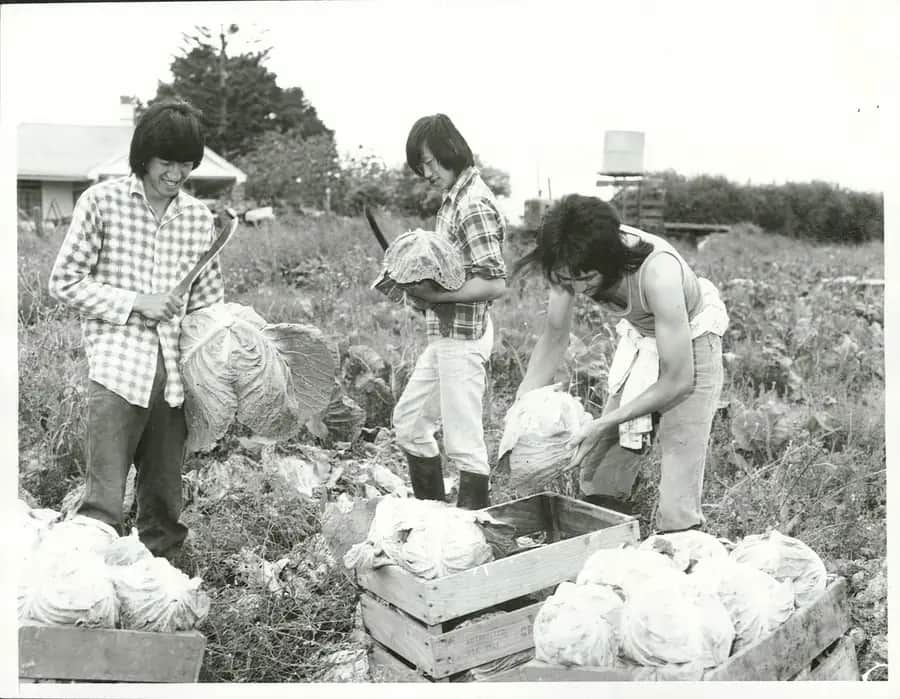
Pick a country place: Pukekohe's market gardens where Chinese and Indian families worked the land for generations, a dairy district where Filipino and South American farm workers now live, or a rural Māori community whose young people moved to the cities after the war. Ask why some rural places empty out while others fill up.
TRACE
Week by week
Two sessions a week, each with Getting started and Stretch support so the whole class works together.
- W1Why people move, and the waves that reached AotearoaTime & Place: Push, pull and the suitcase · Time & Place: Waves of arrival
- W2Schemes, journeys and ties to homeTime & Place: Assisted Passage and the post-war shift · Relationships: Networks and ties to home
- W3Moving within Aotearoa, and hearing people's accountsRelationships: From the country to the city · Accounts: Planning an interview
- W4Barriers and belonging: how migrants shape placesAccounts: What got in the way · Causes & Consequences: Reading the street
- W5Growth, decline and your mapped accountCauses & Consequences: Choropleth maps: growing or shrinking? · Evaluate: Present the mapped account
Hands-on
Activities
Investigations and projects that fit the weeks above. Open one to see what you need and how you'll know it worked.
Push and pullWhy do people leave one place and choose another?Open
You need: story cards describing real kinds of moves (a farmer whose land is too small, a student offered a university place, a family escaping war, a nurse recruited for a hospital, a young person moving to the city for work, a family moving closer to grandparents) · three large sorting mats: push, pull, forced
- Read each story card in your group.
- Find the push factors (reasons to leave) and the pull factors (reasons to go somewhere in particular). Some cards have both.
- Decide which moves were forced: the person had little or no choice. These are refugees or displaced people.
- Sort the factors into types: economic (jobs, money), social (family, education), environmental (drought, cyclones, sea-level rise) and political (war, persecution).
- Pick one card and write the move as a short story from that person's point of view.
How you'll know: You can explain the difference between push, pull and forced migration and give an example of each type of factor.
Go further: Choose a real New Zealand migration wave and list its push and pull factors using Te Ara.
Fits week 1 →Arrows to AotearoaWhere have New Zealand's people come from, and when?Open
You need: a large world map (Pacific-centred if possible) · coloured card or thick wool · sticky notes · Te Ara history of immigration pages
- Mark Aotearoa on the map.
- For each wave, draw or lay an arrow from the place of origin to New Zealand: Polynesian voyagers, British and Irish settlers, Chinese goldminers, Indian arrivals, post-war British and Dutch migrants, Pacific peoples, Asian migrants since the late 1980s, refugees from many countries.
- Make each arrow's thickness roughly match the number of people. This is what makes it a flow map.
- Label each arrow with the time period and one push and one pull factor.
- Add arrows going out too: New Zealanders who emigrated to Australia and the UK.
How you'll know: Your flow map shows at least six waves, with arrow widths and labels that someone else could read.
Go further: Make a digital flow map using a free online mapping tool, or show two time periods side by side.
Fits week 1 →Network webWhat helps a family settle in a new place?Open
You need: a family case study (Pacific, Indian or refugee background; from Te Ara or a local community) · large paper · coloured pens
- Put the family in the middle of the page.
- Draw lines to everyone and everything that helped: relatives already here, a church or temple, a sports club, a school, a workplace, a shop selling familiar food.
- Draw lines in a different colour back to the place of origin: money sent home, visits, family still there, phone calls.
- Circle the connections that helped most in the first year.
- Write a caption: what does this web tell you about why settlement clusters form?
How you'll know: Your web shows local support networks and ties to home, and you can explain why people often settle near others from the same place.
Go further: Compare your web with another group's. What is the same for every family, and what is different?
Fits week 2 →Moving storiesWhat can people's own accounts tell us that data can't?Open
You need: an interview plan · a consent form · a recording device or notebook · a quiet space
- Choose someone who has moved: to New Zealand, from the country to a city, or between towns. It can be whānau, a neighbour, a staff member or a community visitor.
- Explain the project and ask them to sign the consent form. Remind them they can skip any question.
- Ask your open questions and listen. Ask follow-up questions like 'Can you tell me more about that?'
- Write up three key points and one short quote in their own words.
- Show them your write-up and check they are happy with how their words are used.
How you'll know: You have a respectful, accurate record of one person's move, which they have checked and agreed to share.
Safety: Interview people you or your whānau know, or visitors arranged by your teacher. Meet in a public or school space. Nobody has to share a story they don't want to.
Go further: Record a second interview with someone from a different generation or background, and compare the two accounts.
Fits week 3 →Barriers and bridgesWhat has made it hard for people to belong in New Zealand, and what has helped?Open
You need: five source cards (poll tax certificate or record, a 1920s newspaper report on the campaign against Indian market gardeners, an account of the Dawn Raids, a story about unrecognised qualifications, a refugee's account of learning English) · a source-analysis sheet
- At each station, read the source. Who made it, when and why?
- Name the barrier it shows: discrimination, unfair laws, language, qualifications, loneliness.
- Find how people responded: protest, community groups, legal challenges, helping each other.
- Record any government apology or change that followed, and when.
- At the end, list the 'bridges' that help people belong today.
How you'll know: You can describe three barriers using evidence from sources and explain how communities or governments responded.
Go further: Write a short speech for a welcoming event explaining one barrier from history and what your town could do to help newcomers belong.
Fits week 4 →Reading the streetHow can you see migration in the places around you?Open
You need: a street map or base map · a survey sheet · clipboards · coloured dots · adult helpers
- Walk the street in small groups with an adult.
- Tally and mark evidence of migration: restaurants and food shops, places of worship, languages on signs, community halls, festivals advertised, street and building names.
- Note older evidence too: settler churches, Victorian shopfronts, a street named after a New Zealand Company ship or person.
- If a shop owner is happy to talk (with an adult present), ask when and why they or their family came.
- Back in class, put coloured dots on the base map. Look for clusters.
How you'll know: Your map shows where migration is visible on the street and at least one cluster you can explain.
Safety: Stay with your adult, use crossings, and ask before photographing any person, shop or sign that shows private information.
Go further: Compare your street with an old photo of the same street from DigitalNZ. What changed?
Fits week 4 →Shade the changeWhich places are growing, which are shrinking, and why?Open
You need: Stats NZ census counts for 6–10 suburbs or districts (two censuses) · a blank map of the areas · a calculator · coloured pencils in five shades of one colour
- For each area, subtract the older count from the newer count to find the change.
- Divide the change by the older count and multiply by 100 to get the percentage change.
- Make a five-step key, such as: shrinking, no change, small growth, medium growth, big growth.
- Shade each area: the darker the colour, the bigger the growth. Use a different colour for decline.
- Describe the pattern: where are the fastest-growing areas? Suggest causes (new housing, jobs, migration) and consequences (school rolls, traffic, empty shops).
How you'll know: Your choropleth map has a clear key, is shaded correctly, and you can explain one cause and one consequence of the pattern.
Go further: Make a second choropleth for one ethnic group and compare the two maps.
Fits week 5 →Look closer
From the real world
Background reading
Read to understand
Short readings written for Kōkiri Learn students, with their sources.
- Push, pull and forced: why people moveThe reasons people leave one place and choose another, the words geographers use for them, and how flow maps show movement.
- Waves to Aotearoa: who came, when and whyFrom the first Polynesian voyagers to today, the waves of people who made New Zealand, and the laws that decided who could come.
- From the country to the city, and how people shape placesWhy most Māori moved to towns and cities after the Second World War, and how every group that moves changes the place it arrives in.
Trusted NZ sites
Explore more
Placed at the stage of the journey where each one helps.
Time & Place
History of immigration ↗Te Ara
The full story of who came to New Zealand, when and why, from the first voyagers to today.
Time & Place
Assisted immigration revives: 1946 to 1975 ↗Te Ara
How the Assisted Passage and Dutch schemes brought post-war migrants.
Time & Place
Pacific migrations ↗Te Ara
How Polynesian voyagers explored the Pacific and settled Aotearoa, the first great migration.
Relationships
The end of a 'white New Zealand' policy ↗Te Ara
Pacific migration in the 1950s–70s and the 1974 policy change.
Relationships
Urban Māori ↗Te Ara
Why Māori moved to the towns and cities after the war, with numbers and personal stories.
Relationships
Samoans ↗Te Ara
The story of Samoan migration and community life in New Zealand.
Accounts
The Dawn Raids ↗NZ History
Primary sources and accounts of the 1970s raids on Pacific families, and the 2021 apology.
Accounts
Chinese ↗Te Ara
From the Otago goldfields to the poll tax and the 2002 apology.
Accounts
Indians ↗Te Ara
Gujarati, Punjabi and Fijian Indian migration, prejudice and community.
Accounts
Refugees ↗Te Ara
Who has come to New Zealand seeking safety, and the challenges they faced.
Causes & Consequences
Migration ↗Stats NZ
Up-to-date numbers of people arriving in and leaving New Zealand.
Causes & Consequences
Place and ethnic group summaries ↗Stats NZ
Census data for Whanganui and any other place, for your choropleth maps.
Evaluate
DigitalNZ ↗DigitalNZ
Old photos and newspapers to compare how your street has changed.
Evaluate
CensusAtSchool ↗CensusAtSchool NZ
Ideas for collecting and presenting your own class data fairly.
Real audiences
- Your local museum, library or heritage group, for a display or digital story
- The people you interviewed and their whānau, at a class exhibition
- Your council's community or welcoming communities team
Work with other schools
- Swap mapped accounts with a class in a very different place (a city suburb and a rural town) and compare why each place grew or shrank.
- Combine suburb or district data with partner schools to build one big choropleth map of your region.
- Share interview questions and consent forms with a partner class, then hold a video hui to compare the stories each class recorded (with permission).
- Build a shared online flow map where each school adds the migration waves that shaped its town.
Stretch challenges
- Compare the Assisted Passage scheme with New Zealand's refugee quota today: who is chosen, how and why?
- Investigate how climate change might become a push factor for Pacific migration in the future.
- Build population pyramids for your district and for its Māori population and explain the different shapes.
- Research the story of Appo Hocton, New Zealand's first known Chinese settler, and present it as a short illustrated biography.
- Critique a flow map: what does it hide about why people moved and how they felt?
New Zealand Curriculum
What this world covers
Mapped to the refreshed Phase 3 statements. The whole class covers both the Year 7 and Year 8 sequences over two years.
Social Sciences · Geography
International and internal migration: push and pull factors; forced migration, refugees and asylum seekers; flow maps of migration to New Zealand
Year 7 sequence
Social Sciences · Geography
The post-war shift in migrant origins and government schemes (Assisted Passage 1947–1975); Pacific, Asian and Indian migration; Māori rural–urban migration after the war
Year 7 sequence
Social Sciences · Geography
How migrants shape places; settlement clusters and support networks; contributions and barriers such as discrimination, language and unrecognised qualifications; growth and decline on choropleth maps
Year 7 sequence
Social Sciences · Civics and society
Informed citizenship: separating fact from opinion in debates about migration, and sharing people's stories ethically
Year 7 sequence
Mathematics and Statistics · Statistics
Planning data collection for a statistical question and choosing suitable graphs and maps for census data
Year 7 sequence
English · Oral language
Planning and conducting an interview, and presenting a mapped account to a real audience
Year 7 sequence
For teachers: how to run it
This world teaches the Phase 3 Year 7 Geography content on migration in the proposed Social Sciences statement of 12 August 2026: international and internal migration, including immigration, emigration and rural–urban movement; push and pull factors; forced migration, refugees and asylum seekers; flow maps; the post-war shift in migrant origins and government schemes; settlement clusters and support networks; how migrants shape shops, services, language and buildings; cultural, economic and political contribution; barriers including discrimination, language and unrecognised qualifications; ties to the place of origin; Māori migration to the cities after the war; and growth and decline shown on choropleth maps. It condenses the Whanganui Intermediate Year 7 Term 2 sequence (Cycle A: Te Awa Tupua; Cycle B: Growth and decline) into five weeks, keeping the fieldwork, the shared base map and the evidence of learning: a mapped account of how migration has changed one neighbourhood, with the impact on the migrant community and on the place. From the WIS Population Demographics essay: New Zealand's population cannot be explained by natural increase alone (it is 'a country made by migration'), and one place can hold several population structures at once (in Whanganui the Māori population is much younger than the district as a whole). Year 8 students in a combined class can take the data and mapping lead and link to Te Awa Tupua. Care with personal stories: migration can reach into painful history, including refugee journeys, family separation, adoption and immigration status. Always let students write about any move (including a move within Aotearoa or to a new house) or interview a neighbour or staff member instead of whānau; never ask about visas or citizenship; get consent before recording anyone and let interviewees check how their words are used. Keep discussion about migration policy even-handed: agree on the data together, then examine the different arguments people make as values questions. Honest history: the Chinese poll tax (1881–1934, apology 2002), the White New Zealand policies, the 1920s campaign against Indian market gardeners and the Dawn Raids of the 1970s (apology 2021) are taught plainly and without graphic detail, alongside the ways communities resisted and contributed. Tangata whenua: Māori are not 'migrants' in the same sense as later arrivals; teach the Polynesian voyaging settlement as the first arrival and the post-war move to the cities as internal migration on their own whenua. Work with mana whenua through the school's relationships for any local Māori migration stories, and do not ask Māori students to speak for their iwi. Prep: Stats NZ place summaries for your district and suburbs (2013, 2018 and 2023 census counts), a blank base map of your area and of the world, a Te Ara immigration timeline, string and coloured card for flow maps, and interview release forms. Fieldwork: a walking survey of a main street needs a risk plan, adult helpers, road safety rules and permission before photographing people or inside businesses. Differentiation: picture push/pull cards, a partly completed flow map, sentence frames for interview questions; stretch with population pyramids, a comparison of two censuses, or a critique of what flow maps hide. Kārearea asks one question during week 3; it never gives answers.
Plan this world into any term with the two-year planner. Students can record their thinking in their Kōkiri Learn portfolio.
More Social Sciences worlds
 4 weeksTō Mātou Rohe: Stories of Our Place
 5 weeksMana Motuhake: Power, Decisions and People
 5 weeksTe Awa Tupua: Rivers, Floods and People
 5 weeksShaky Isles: Hazards and Getting Ready
 5 weeksSilk Roads and Sea Routes: When Worlds Trade
 5 weeksStanding Up: Civil Rights and Youth Voice
 5 weeksOur Money, Our Community
Ready to run it with your class?
Free trial for NZ schools. One combined Years 7–8 class, any term.