Mathematics and Statistics · World 6 of 8 · Years 7–8
Games of Chance: Probability Lab
Roll, spin, flip and draw hundreds of times to find out which games are really fair, then design a fair game for the school gala.
Big question: How can we tell whether a game of chance is fair, and how can we design one that is?
- You'll make
- A tested gala game stall with rules, a probability poster showing the theoretical chance of winning and the results of at least 100 trials, and a short explanation of why the game is fair.
- For
- Players and whānau at the school gala, the gala or PTA committee who approve stalls, and junior classes who play-test the games.
- Time
- 5 weeks · 2 sessions a week
Your mission
Why it matters
The school gala committee wants new game stalls, but last year a parent complained that one game was 'impossible to win'. Your class has been asked to test the old games, work out the real chances of winning, and design a new game that is fair, fun and clearly explained to players.
Chance is everywhere: the weather forecast, a coin toss at the start of a match, a raffle, a medical test, even which team you get picked for. People who understand probability are harder to trick, make better decisions about risk, and can spot when a game or a deal is stacked against them.
Your first step
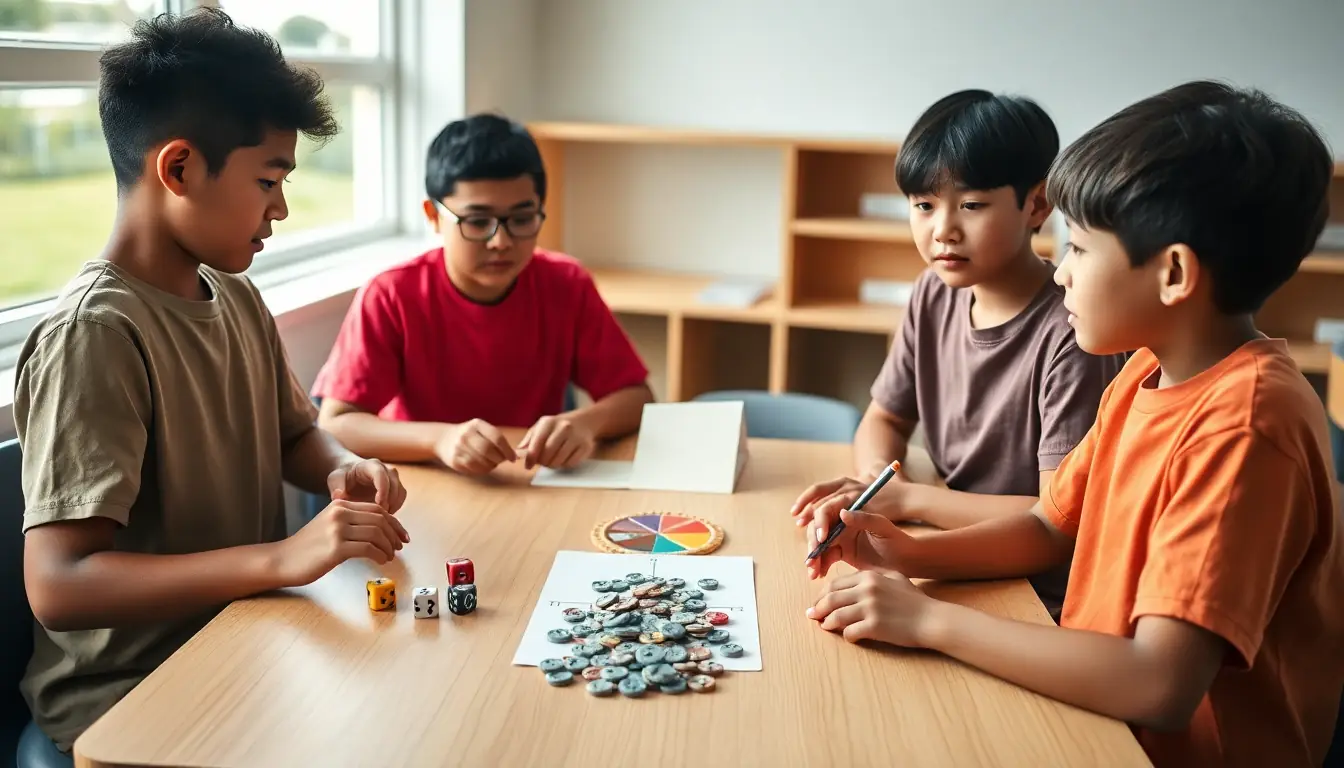
Play 'Winning Differences' with a partner: roll two dice and find the difference. Player A wins on 0, 1 or 2; Player B wins on 3, 4 or 5. Before you start, predict: is it fair?
Make it yours
Choose a context
Same big question, three different places to explore it. Pick the one that fits your class and community.
The school gala
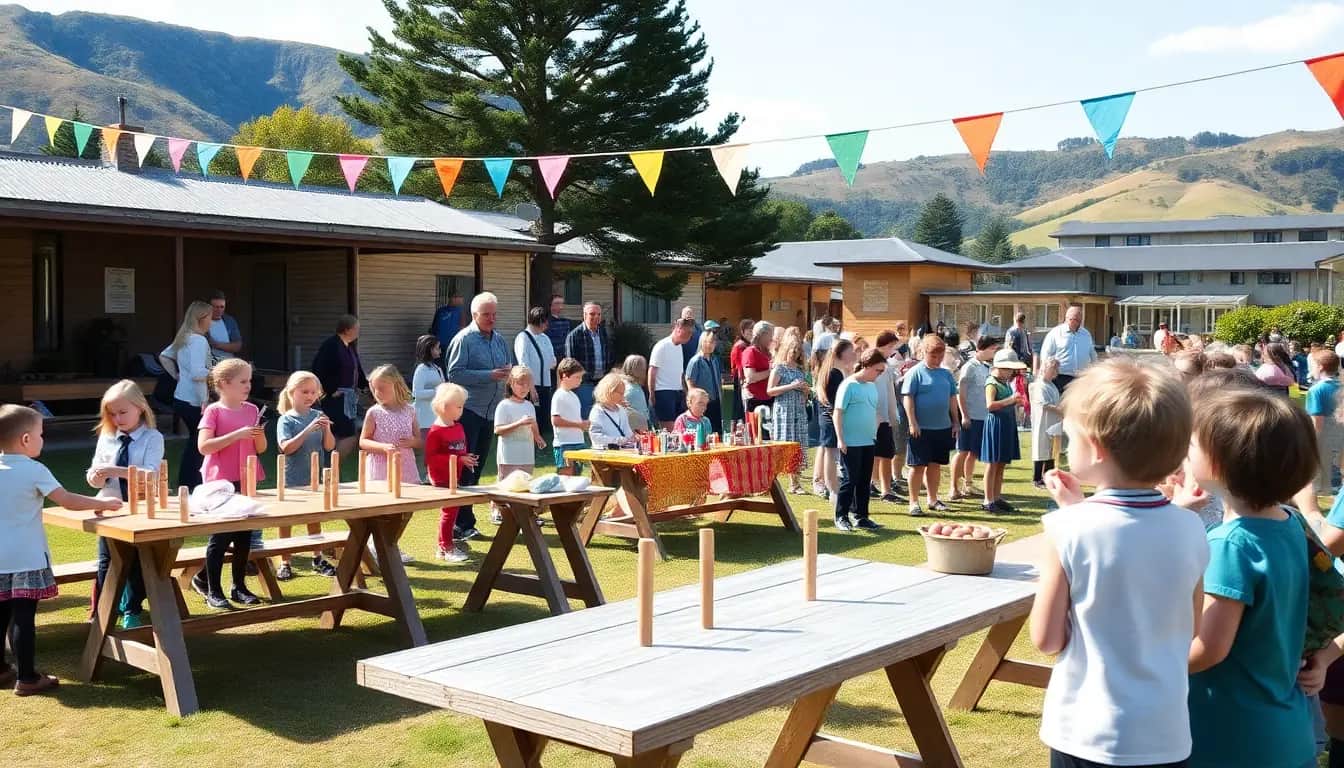
Test classic stall games like 'guess the colour', ring toss and lucky dip, then design a new game of chance for the gala. Prizes are small and every player should know their real chances.
Sport and fair play
Is the coin toss at the start of a match really 50–50? Is picking teams from a hat fair? Investigate the draws, tosses and random choices used in sport, and design a fairer way to choose who goes first.
Weather, risk and everyday chance
What does '70% chance of rain' mean? Use records of past weather and simple experiments to explore how forecasters, farmers and event planners use probability to make decisions.
SOLVE
Week by week
Two sessions a week, each with Getting started and Stretch support so the whole class works together.
- W1Is it fair? Games, hunches and predictionsSee the Pattern: Winning Differences · See the Pattern: The language of chance
- W2Collecting results carefullyOrganise Information: Thirty flips, three hundred flips · Organise Information: Listing every outcome
- W3Theory meets experimentLink Ideas: The dice race · Link Ideas: Complements and spinners
- W4Design the gala game and test it hundreds of timesVerify: Design and predict · Verify: The 100-trial test
- W5Fix it, prove it, run the stallVerify: Play-test with real players · Explain: Probability poster and gala launch
Hands-on
Activities
Investigations and projects that fit the weeks above. Open one to see what you need and how you'll know it worked.
Winning DifferencesIs a game where one player wins on differences of 0, 1 or 2 fair?Open
You need: Two dice per pair · Tally sheet · Pencil
- Player A wins if the difference between the two dice is 0, 1 or 2. Player B wins on 3, 4 or 5.
- Predict who will win more often.
- Play 30 rounds and tally the winner of each.
- Draw a 6 × 6 table showing every possible difference.
- Count the ways each player can win and compare with your tally.
How you'll know: You can show with the table that A has 24 of the 36 outcomes, and explain why your 30 rounds might not show exactly that.
Go further: Change the rules so that the game becomes fair. Prove it with the table.
Fits week 1 →Coin flip class poolWhat happens to the share of heads as we flip more and more times?Open
You need: A coin each · Tally sheet · Class spreadsheet or wall chart
- Flip your coin 30 times and record heads and tails.
- Work out your percentage of heads.
- Add your results to the class total, one pair at a time.
- After each pair is added, work out the class percentage of heads and plot it on a line graph.
- Describe what happens to the line as the number of flips grows.
How you'll know: Your graph shows the percentage of heads swinging a lot at first and then settling close to 50%.
Go further: Find out about John Kerrich, who flipped a coin 10,000 times. How close did he get to half?
Fits week 2 →The two-dice raceWhy do some totals come up far more often than others?Open
You need: Two dice · A race track drawn with 11 lanes numbered 2 to 12 · Counters
- Put a counter at the start of each lane.
- Roll two dice, add them, and move that lane's counter forward one step.
- Keep going until one counter reaches the finish (8 steps).
- Run three races and record the winners.
- Use a 6 × 6 table to find how many ways each total can be made.
How you'll know: You can explain why 7 has a 6/36 chance, while 2 and 12 have only 1/36 each.
Go further: Change the race to use the product of the two dice instead. Which lane is favourite now?
Fits week 3 →Spinner sector anglesHow do you build a spinner with exactly the chances you want?Open
You need: Card · Protractor · Compass or round lid · Split pin or pencil and paper clip · Coloured pencils
- Choose probabilities that add to 1, for example 1/2, 1/4, 1/6 and 1/12.
- Work out each sector angle: 360° × probability.
- Draw the circle, measure the angles and colour the sectors.
- Spin 30 times and record each colour.
- Compare the experimental results with the theory, then pool with another group.
How you'll know: Your sector angles add to 360° and your pooled results move closer to the probabilities you chose.
Safety: Take care with compass points and split pins.
Go further: Design a spinner that looks fair but isn't. Can another group spot the trick?
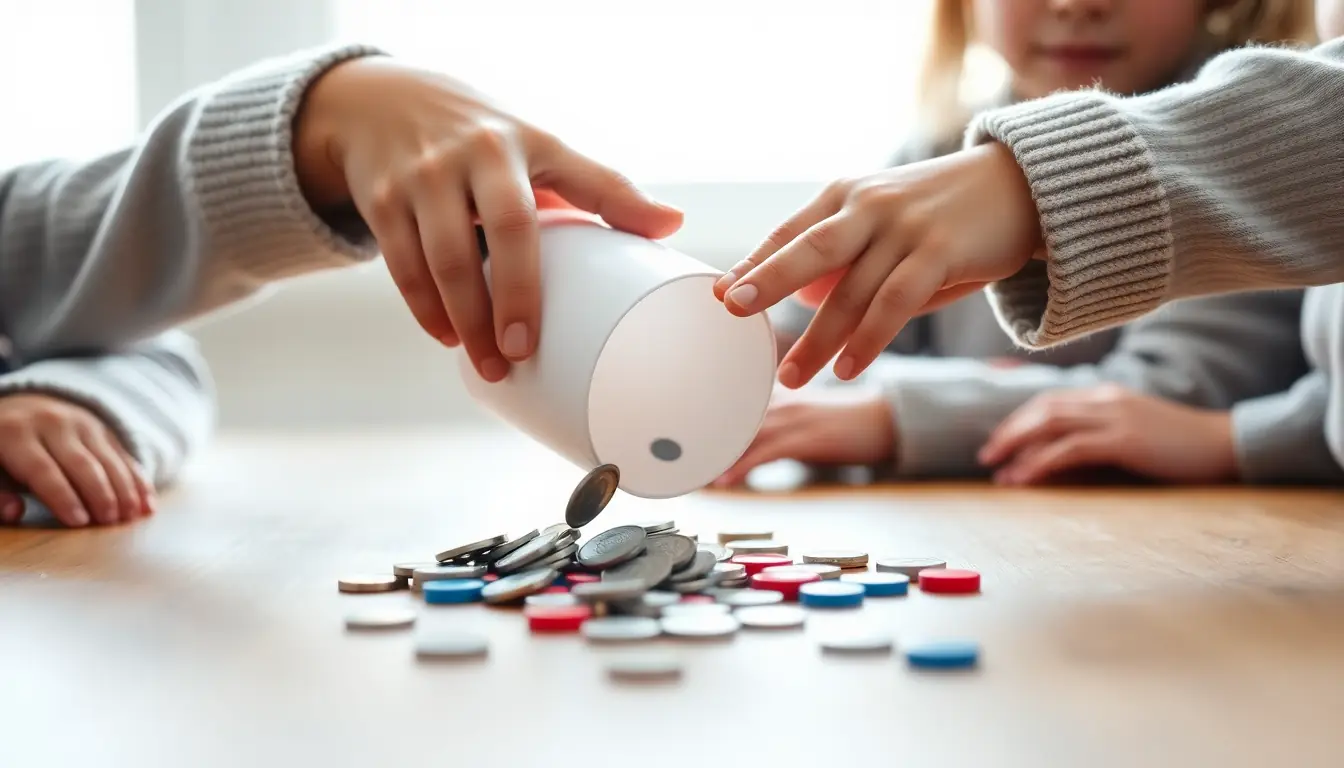
Fits week 3 →The paper cup dropWhat is the chance of a cup landing upright, upside down or on its side, when theory can't tell you?Open
You need: Paper or plastic cups · Tally sheet · Bottle caps (optional)
- Drop a cup from the same height 30 times and record how it lands.
- Work out the experimental probability of each landing.
- Combine with other groups to get 100 or more drops.
- Compare the 30-drop and 100-drop probabilities.
- Discuss why you can't work this out with a sample space like a die.
How you'll know: You can give a probability estimate for each landing and explain why more trials make it more reliable.
Safety: Use cups or bottle caps rather than drawing pins. Drop from a safe height, not standing on chairs.
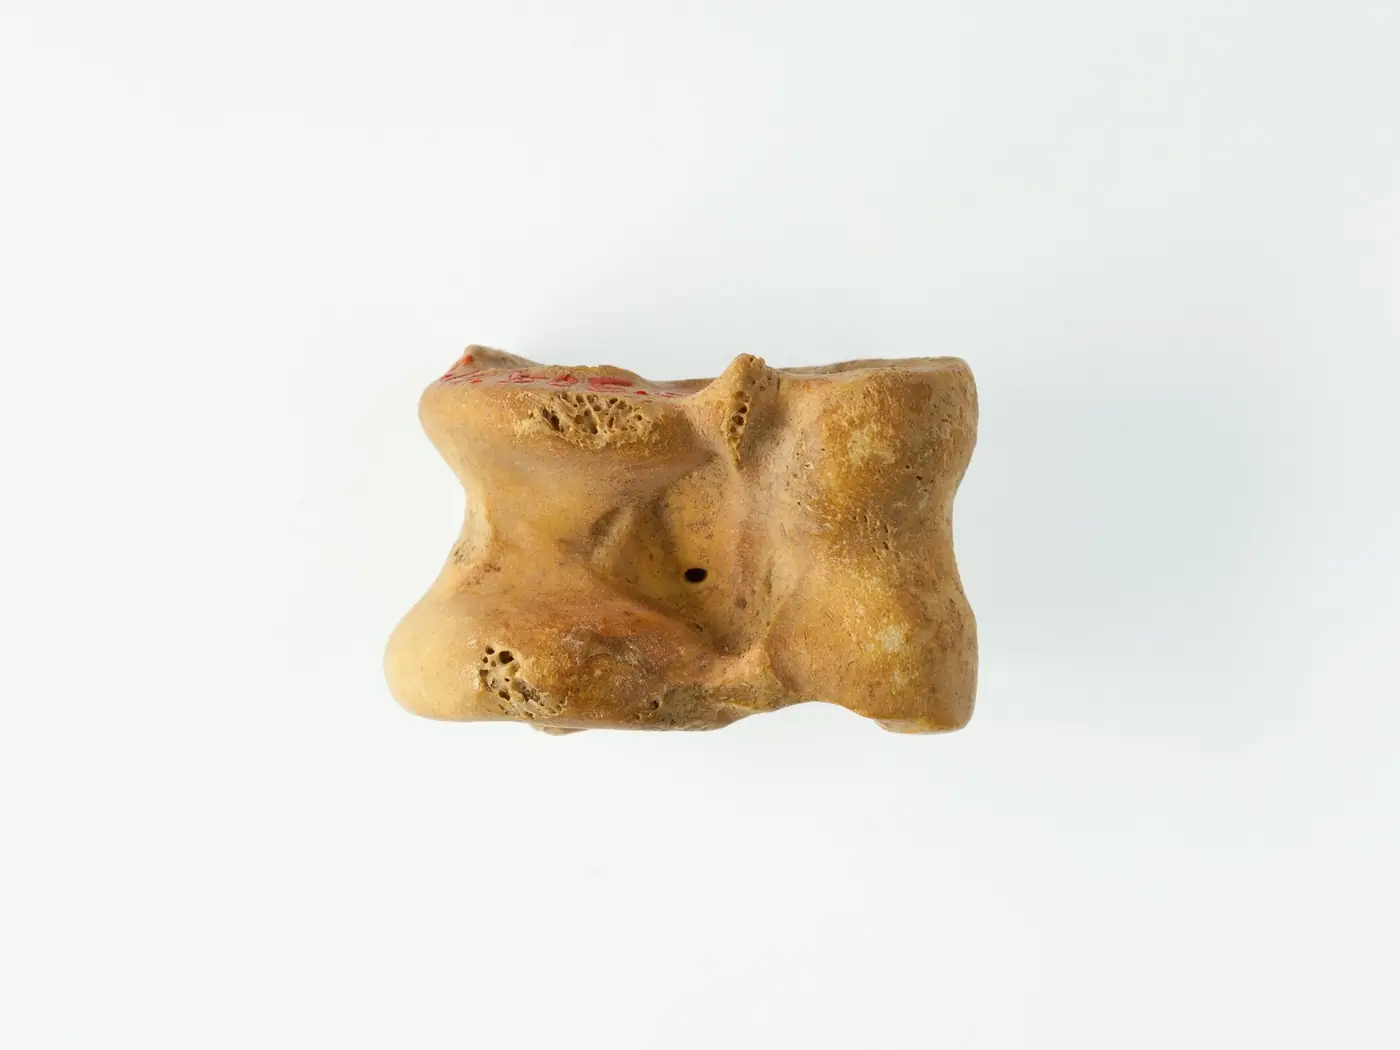
Go further: Test a bottle cap too. Knucklebones, one of the oldest games of chance, worked the same way.
Fits week 3 →Mystery bag detectivesCan you work out what is inside a bag without looking?Open
You need: Opaque bag · 10 counters in two or three colours · Tally sheet
- A partner secretly puts 10 counters in a bag.
- Draw one, record the colour, and put it back. Shake the bag.
- After 20 draws, predict how many of each colour are inside.
- Do 30 more draws. Update your prediction.
- Open the bag and compare.
How you'll know: Your prediction after 50 draws is closer than after 20, and you can explain why.
Go further: What is the probability of NOT drawing red? Use the complement of your estimate.
Fits week 1 →Gala game 100-trial testDoes our gala game give players the chance we say it does?Open
You need: Your game equipment · Recording sheet · Calculator or spreadsheet
- Write the rules and the theoretical chance of winning.
- Play the game 100 times, recording win or lose each time.
- Every 10 plays, work out the percentage of wins so far.
- Plot the running percentage on a line graph with the theoretical probability as a line across it.
- Decide whether the game behaves as you predicted, and change it if not.
How you'll know: Your graph shows your results settling near the theoretical line, and your poster matches the evidence.
Safety: If you use food as prizes, check for allergies first.
Go further: Work out the expected number of prizes the stall will give away for 200 players.
Fits week 4 →Look closer
From the real world
Background reading
Read to understand
Short readings written for Kōkiri Learn students, with their sources.
- Why 30 tries is not enoughExperimental probability, why results jump around, and how the Law of Large Numbers brings them back into line.
- Counting the chances: sample spaces, tables and treesHow to list every possible outcome, calculate theoretical probability, and use complements to save time.
- Fair games, the stall and the LottoWhat makes a game fair, why the stall usually wins, and what the real chance of winning Lotto looks like.
Trusted NZ sites
Explore more
Placed at the stage of the journey where each one helps.
See the Pattern
Probability ↗Maths Is Fun
A clear first explanation of chance, outcomes and probability as a number.
Organise Information
Probability tree diagrams ↗Maths Is Fun
How to list every outcome of two or more events without missing any.
Organise Information
Dice roller ↗RANDOM.ORG
Roll lots of true random dice online when you need more trials quickly.
Link Ideas
Probability: types of events ↗Maths Is Fun
Complementary, independent and mutually exclusive events explained with examples.
Link Ideas
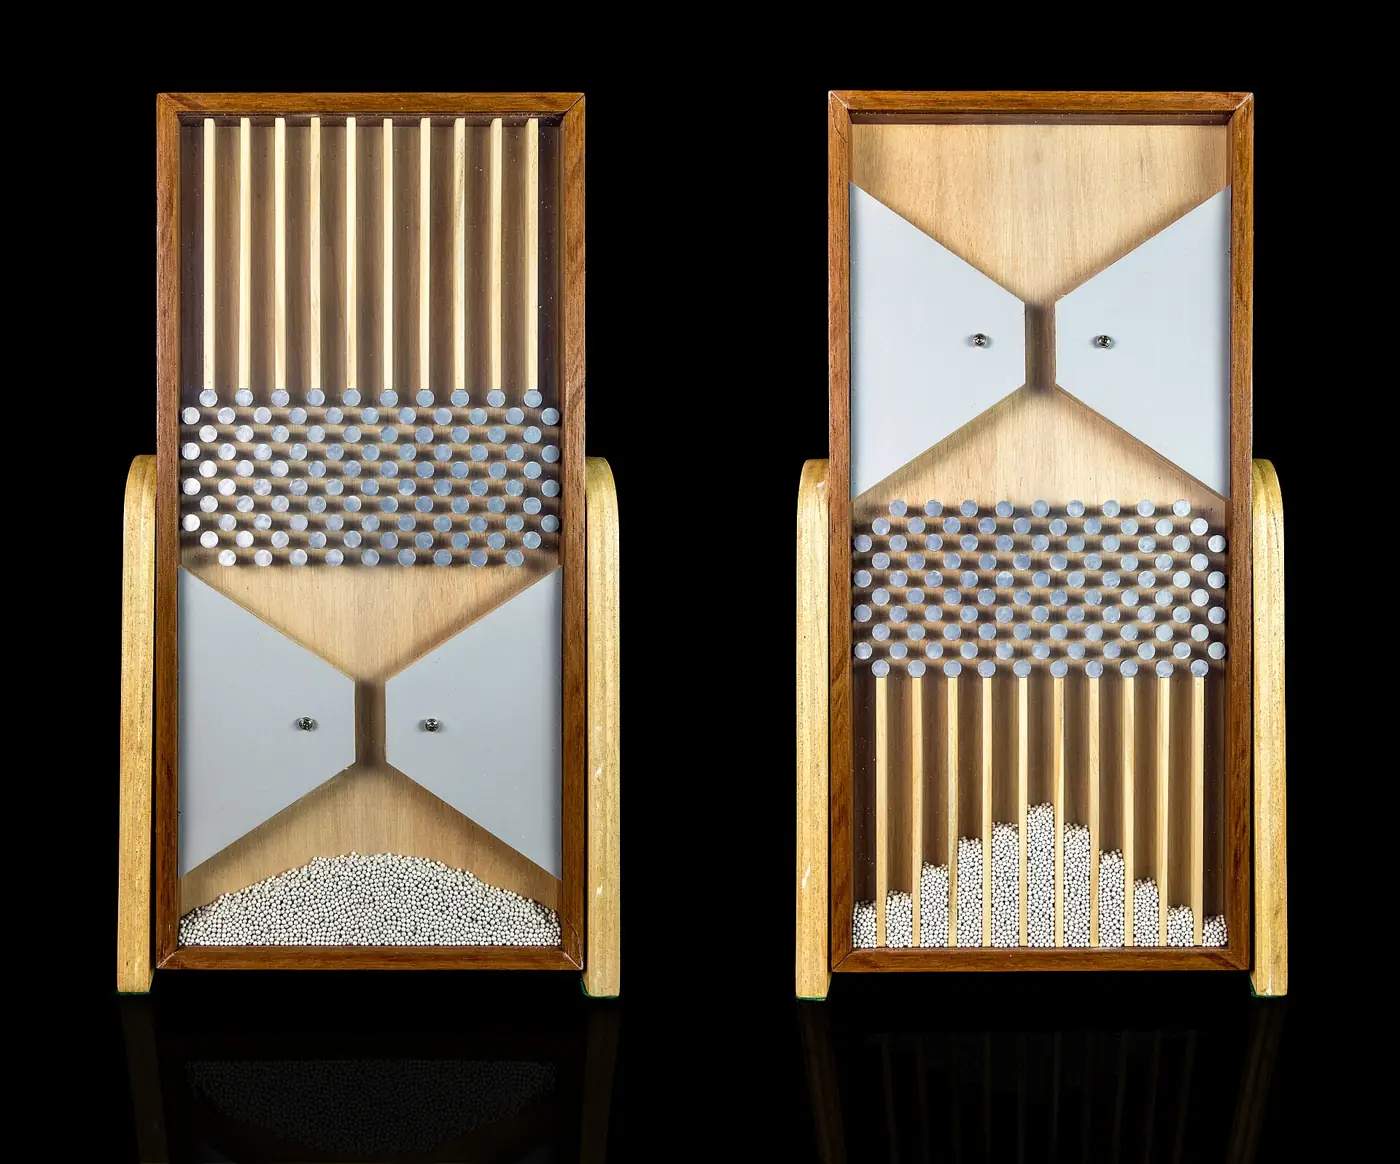
Quincunx (Galton board) ↗Maths Is Fun
An interactive Galton board to see random bounces build a predictable shape.
Verify
Polypad ↗Amplify
Virtual dice, coins and spinners that can run hundreds of trials and graph them.
Verify
Year 7 & 8 probability ideas ↗CensusAtSchool New Zealand
New Zealand probability activities and teaching ideas for this age group.
Verify
Probability ↗NRICH, University of Cambridge
Games and puzzles for testing fairness and reasoning about chance.
Explain
How Lotto works ↗Health New Zealand Te Whatu Ora – Safer gambling
The real odds behind Lotto, explained by New Zealand's health service.
Explain
The rules for running a gambling activity ↗Te Tari Taiwhenua Department of Internal Affairs
The New Zealand rules for raffles and fundraising games, for teachers and gala committees.
Real audiences
- Players and whānau at the school gala or market day
- The gala or PTA committee who decide which stalls go ahead
- A junior class who play-test the games and give feedback
Work with other schools
- Pool coin, cup-drop and dice results with classes at other schools in a shared spreadsheet to reach thousands of trials, and graph how the percentages settle.
- Swap gala game designs with a partner school: each class tests the other's game 100 times and sends back its results and a fairness verdict.
- Run a joint 'Is it fair?' online challenge: each class posts a game with a hidden bias and the other class designs experiments to find it.
Stretch challenges
- Research the Monty Hall problem, then test it with three cups and a counter 50 times. Were you surprised?
- A single line of Lotto has a 1 in 3,838,380 chance of winning first division. Find something else that is about as likely, and make a picture that shows how small that chance is.
- Build a simple Galton board with nails and a board (with an adult) or a paper-cup version, and explain the shape the balls make.
- Use a spreadsheet to simulate rolling two dice 10,000 times and compare the graph with your 6 × 6 table.
New Zealand Curriculum
What this world covers
Mapped to the refreshed Phase 3 statements. The whole class covers both the Year 7 and Year 8 sequences over two years.
Mathematics and Statistics · Probability
Chance experiments with at least 30 trials; comparing experimental and theoretical probability and explaining why they differ
Year 7 sequence
Mathematics and Statistics · Probability
Experiments with 100+ trials to show the Law of Large Numbers; probabilities as fractions, decimals and percentages; complementary events
Year 8 sequence
Mathematics and Statistics · Number
Converting between fractions, decimals and percentages
Year 7 sequence
Mathematics and Statistics · Statistics
Displaying and comparing results with dot plots and bar graphs
Year 8 sequence
Technology · Design and innovation
Designing, testing and improving a game with feedback from users
Year 7 sequence
For teachers: how to run it
Prep: collect dice (including some ten-sided or blank dice), coins, counters, paper cups, drawing pins or bottle caps, card for spinners, split pins, and opaque bags. Set up a shared class spreadsheet or large wall chart so group results can be pooled into hundreds and then thousands of trials; CODAP, Polypad or a spreadsheet RAND function can simulate thousands more. Gambling care: this world is about fairness and risk, not gambling. Games use counters or tokens, never money stakes; gala prizes should be small and non-cash and follow the school's fundraising policy. If you run a raffle alongside, follow the Department of Internal Affairs rules for class 1 gambling. Some students may have whānau affected by gambling harm, so keep the Lotto discussion factual and non-judgemental and know where support is (Health NZ's safer gambling site, the Problem Gambling Foundation). Safety: drawing pins go point-up, so use bottle caps or paper cups with younger or less careful groups; check for food allergens if lollies are used as prizes. Differentiation: start with one die, coins and 'more likely / less likely' language; move to fractions, decimals and percentages, two-dice tables and tree diagrams; extend to expected value, three-stage trees and the Monty Hall problem. Students who find recording hard can be the 'roller' while a partner tallies, then swap. Tohu asks one question when groups check their gala game, about how they know it is fair; it never supplies probabilities. Cross-curricular: spinner sector angles link to Geometry; the gala stall links to Technology design and Social Sciences economic activity.
Plan this world into any term with the two-year planner. Students can record their thinking in their Kōkiri Learn portfolio.
More Mathematics and Statistics worlds
 4 weeksWhat the Data Shows
 5 weeksPatterns, Proof and Prediction
 5 weeksMoney Moves: Budgets, Percentages and Interest
 5 weeksMeasure Up: Designing Spaces
 5 weeksFind Your Way: Maps, Angles and Coordinates
 5 weeksNumber Detectives: Primes, Powers and Codes
 5 weeksShape Shifters: Transformations and Tessellation
Ready to run it with your class?
Free trial for NZ schools. One combined Years 7–8 class, any term.