
Technology · World 7 of 8 · Years 7–8
Data Detectives: Data, Spreadsheets and AI
Count it, code it, chart it, question it. Turn real local data into a true story, then find out when AI can be trusted.
Big question: How can we collect, store and read data so it tells a true story, and how do we decide when a computer, or an AI, should be trusted with the job?
- You'll make
- A data story: a clean spreadsheet of data your class collected, two honest charts that answer your question, a one-page poster or slide explaining what you found, an 'AI suitability card' that judges whether an AI tool should be used for your task, and a class data promise saying how the data is kept safe.
- For
- The people who can act on your findings: the principal or board (school travel data), a local predator-free or bird group (bird counts), or a DOC ranger or marine reserve guardian (fish counts). Younger students at your school also test your 'AI or not?' game.
- Time
- 5 weeks · 2 sessions a week
Your mission
Why it matters
Every day, people in Aotearoa count things that matter: birds in backyards during the Garden Bird Survey, cars and bikes outside the school gate, fish in marine reserves filmed by DOC cameras. Your class becomes a data team with a real question from your community: collect the data yourselves, turn it into a clean spreadsheet and clear charts, then test whether an AI could do the counting better, and whether it should.
Data decides things. Councils use counts to choose where footpaths and crossings go. DOC uses fish and bird counts to decide whether a reserve is working. Apps collect data about you every time you tap. AI tools are trained on huge piles of data, and if that data is messy, unfair or missing people, the AI will be too. When you know how data is gathered, stored and shown, you can spot a misleading chart, protect your own privacy and ask sharp questions about AI instead of just believing it.
Your first step
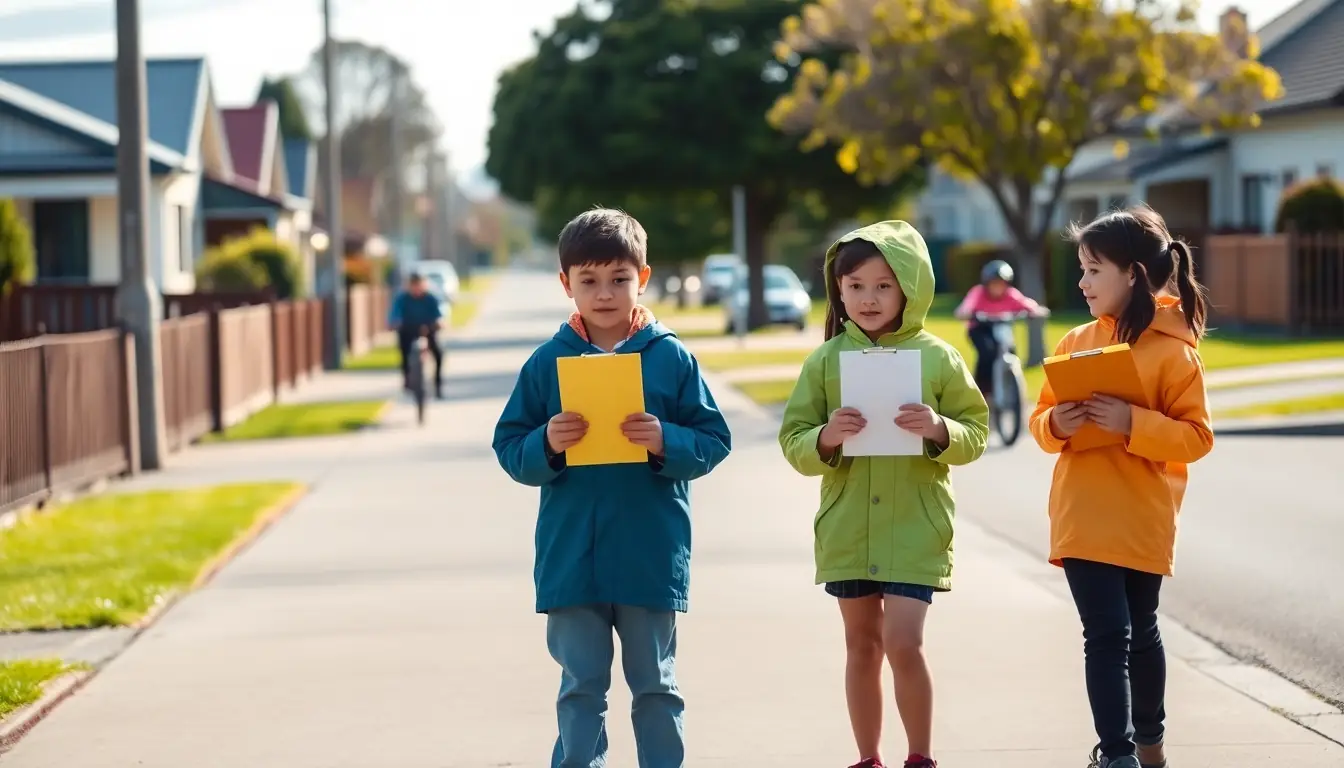
Write down everything you did yesterday that left data behind: a bus card tap, a game score, a photo, a search, a library book. Next to each one, write who might have that data now.
Make it yours
Choose a context
Same big question, three different places to explore it. Pick the one that fits your class and community.
Backyard birds: count the manu in your neighbourhood
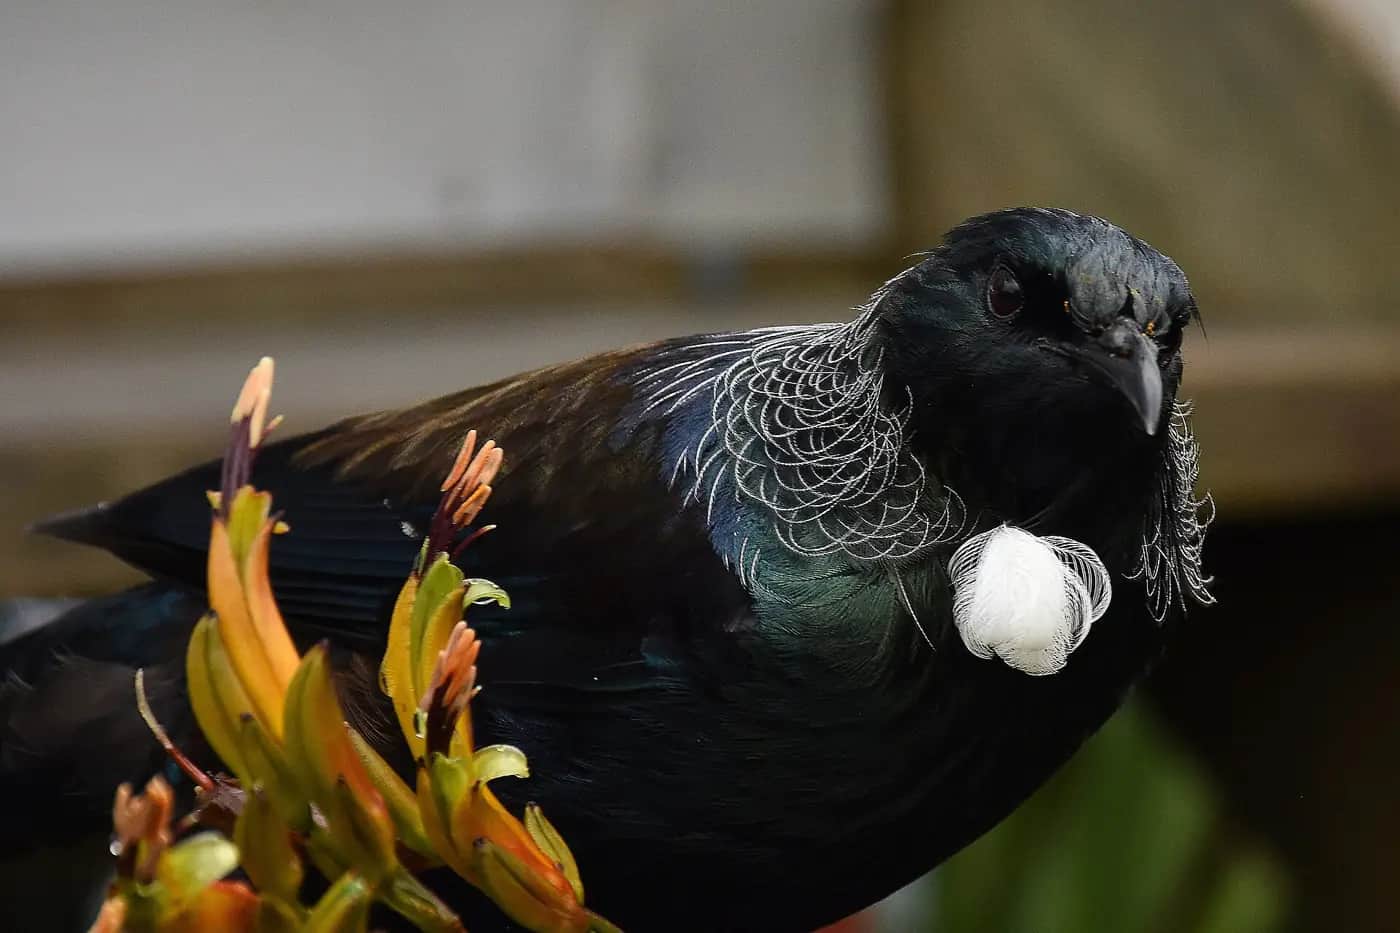
Every winter, thousands of people across Aotearoa spend one hour counting the birds in their garden for the New Zealand Garden Bird Survey, run by Manaaki Whenua – Landcare Research. Run your own counts in the school grounds and at home, then compare them with national results. Are tūī, pīwakawaka and kererū doing better near bush? Could an AI identify birds from photos as well as you can?
Street smart: how does our school get here?
Count how students and whānau arrive at school: walking, scooting, biking, bus or car. Collect a week of tallies at the gate, survey classes without collecting names, and find patterns by day and weather. Your data could help the principal and the council decide about crossings, bike racks or a walking school bus. This context is all about collecting data about people fairly and keeping it private.
Reef watch: fish counts in a marine reserve
DOC films fish in marine reserves such as Te Tapuwae o Rongokako near Gisborne and Horoirangi near Nelson, and volunteers count them online through Spyfish Aotearoa. Those counts are also used to train an AI to recognise fish. Count fish in short video clips yourself, build a dataset, and investigate how good the AI is, what it gets wrong, and why people are still needed.
DESIGN
Week by week
Two sessions a week, each with Getting started and Stretch support so the whole class works together.
- W1Find the data all around you and learn how computers store itDiscover: Your data trail · Explore: Everything is ones and zeros
- W2Collect data carefully and plan how to store itExplore: Out in the field · Sketch: Design the dataset
- W3Clean the data and find the patternsSketch: Into the spreadsheet · Improve: Charts that tell the truth
- W4Train an AI, test it and find its blind spotsImprove: Teach a machine · Improve: Is AI right for this job?
- W5Share your data story and decide what happens to the dataGive Value: Data story day · Navigate Constraints: Privacy, security and the data promise

Hands-on
Activities
Investigations and projects that fit the weeks above. Open one to see what you need and how you'll know it worked.
Data trail diaryHow much data do you leave behind in a single day, and who ends up holding it?Open
You need: A sheet of A3 paper · Three coloured pens · A clock or timetable of your day
- Draw a timeline of yesterday from waking up to going to sleep.
- Mark every moment you created data: a bus card tap, a text, a photo, a game score, a search, a library book scan, a shop receipt.
- Colour each one: green if you chose to share it, orange if you knew but did not think about it, red if you did not know it was collected.
- Next to each, write who might hold that data now: a company, the school, the council, a friend.
- Count each colour. Which is biggest?
- Pick one red item and write one way to reduce that data in future.
How you'll know: You can name at least eight pieces of data you created and explain the difference between data you shared on purpose and data collected about you.
Go further: Find the privacy settings on one app or device at home with a parent and change one setting that shares less data.
Fits week 1 →Binary braceletsHow can a computer store your name using only on and off?Open
You need: Two colours of beads (or two colours of paper squares and glue) · String or a paper strip · A binary alphabet chart (A = 01000001, B = 01000010…) · Binary cards with 1, 2, 4, 8 and 16 dots
- Practise with the dot cards: show 9 using face-up cards (8 + 1). Try 14 and 27.
- Look up the binary code for your initials on the alphabet chart. Each letter uses eight bits.
- Choose one colour for 1 and another for 0.
- Thread or glue eight beads for each initial, leaving a gap between letters.
- Swap bracelets with a partner and decode each other's initials.
- Count the bits. How many bytes did your initials need?
How you'll know: Your partner decodes your bracelet correctly and you can explain that each bead is one bit and eight bits make a byte.
Safety: Keep small beads away from younger children who might visit the classroom.
Go further: Encode a short word such as 'kia ora'. How many bytes does it need, including the space? Macrons need more bits: find out why.
Fits week 1 →Pixel pictures and compressionHow does a computer store a picture, and how can it make the file smaller?Open
You need: 10 × 10 grid paper · A black pen or pencil · A partner and a screen to hide your drawing
- Colour squares on the grid to make a simple picture: a fish, a bird or a letter.
- Describe your picture row by row using 1 for black and 0 for white. Count how many numbers you needed (it should be 100).
- Now describe it a shorter way: for each row, say how many whites, then how many blacks, and so on (for example 3, 4, 3). This is called run-length encoding.
- Count the numbers again. How much shorter is it?
- Read your numbers to a partner who cannot see your grid. Can they redraw it exactly?
- Try a picture with lots of changes (a chessboard). Does compression still help?
How you'll know: Your partner redraws your picture correctly from numbers alone, and you can explain why some pictures compress better than others.
Go further: Find out why a photo saved as a JPG is smaller than a PNG, and what quality you lose.
Fits week 1 →The fair countHow do you collect data that others can trust?Open
You need: A clipboard and tally sheet for each pair · A timer · A bird ID sheet, a gate tally sheet, or a device showing Spyfish Aotearoa clips · Pencils
- Agree your method as a class: the exact place, the start time, the length of the count and what counts (for example, only birds that land).
- Birds: record the highest number of each kind you see at one time, so you do not count the same bird twice. Travel: tally each person once as they pass the gate. Fish: pause the clip and count the most fish of each kind in one frame.
- Two pairs count the same thing at the same time, without talking to each other.
- Compare your tallies. Circle any differences.
- Discuss why they differ: hard-to-see birds, people in groups, fish hiding.
- Write one change to the method that would make the next count more reliable.
How you'll know: Two pairs counting the same thing get results that are close, and you can explain what caused the differences.
Safety: Outdoors: stay inside the agreed boundary and with your partner. At the school gate, stand back from the kerb and never step onto the road or driveway.
Go further: Repeat the count on a different day and compare. Is the change bigger than the difference between counters?
Fits week 2 →Spreadsheet clean-up crewWhy is real data messy, and how do you clean it without changing the truth?Open
You need: A device with Google Sheets, Excel or Numbers · The class messy dataset · A checklist of cleaning steps
- Open the messy dataset and make a copy, so the original is kept safe.
- Sort by the name column. Find every different spelling of the same thing (tui, Tūī, TUI) and make them match.
- Find the duplicates: rows that are exactly the same. Decide whether they are real repeats or entered twice.
- Find the outlier: one number that looks far too big or small. Check the tally sheet before you change it.
- Fill blank cells if you know the answer, or write 'missing' if you do not. Never guess.
- Use COUNTIF to count how many of each kind, and SUM for the total. Check one by hand.
- Write a cleaning log: every change you made and why.
How you'll know: Your cleaned totals match the checked answers, and your cleaning log lets someone else see exactly what you changed.
Go further: Use a filter to show only one place or one day, then make a chart that compares two filtered groups.
Fits week 3 →Chart detectiveHow can a chart tell the truth, or trick you, with the very same numbers?Open
You need: Three printed misleading charts · Your clean dataset · A device with a spreadsheet · Coloured pens
- Look at the first chart. Check where the vertical axis starts. Does it start at zero? How does that change what you see?
- Look at the second. Are the time gaps even? Look at the third, a 3D pie. Which slice looks biggest, and is it really?
- Redraw one misleading chart honestly by hand.
- Make a bar chart from your own data. Add a title that asks your question, labels on both axes, and units.
- Now make a misleading version of the same chart on purpose.
- Show both to another group. Can they spot the trick?
How you'll know: You can name at least two tricks that make charts misleading and your honest chart has a clear title, labelled axes, units and a scale starting at zero.
Go further: Find a chart in a news story or advertisement and judge whether it is honest. Suggest one fix.
Fits week 3 →Teach a machine, then fool itHow does an AI learn from examples, and what happens when the examples are unfair?Open
You need: A laptop with a webcam and Teachable Machine (teachablemachine.withgoogle.com) · Two kinds of object, such as harakeke and kawakawa leaves, or cans and plastic bottles · A plain sheet of paper and a patterned cloth for backgrounds
- Open Teachable Machine and choose an image project with two classes.
- Hold up object one against the plain paper and record at least 30 examples, turning it to different angles. Repeat for object two.
- Train the model and test it with new objects it has not seen. Record how often it is right out of 10 tries.
- Start a new model. This time, record object one only on the plain paper and object two only on the patterned cloth.
- Now swap the backgrounds and test. What does the model think? What has it really learned?
- Write a note: what went wrong, and how you would choose better training data.
How you'll know: You can explain, with your test results, that the second model learned the background instead of the object, and why biased training data makes AI unfair.
Safety: Train on objects only, never on people's faces. Wash hands after handling leaves, and do not use plants you cannot identify.
Go further: Add a third class with only five examples. How does having less data change the model's accuracy?
Fits week 4 →AI or not? The suitability card gameWhen should we use AI for a job, and when should a person do it?Open
You need: A set of 12 scenario cards (for example: counting fish in 10,000 hours of video, choosing who gets a school award, translating a te reo Māori pepeha, spotting spam emails, marking a speech) · A sorting mat with three columns: good fit, use with care, not suitable · Pens
- Read each scenario card in your group.
- Ask three questions: Accuracy: how bad is it if the AI gets it wrong? Fairness: could it treat some people unfairly? Context: does it need care, culture or feelings a machine does not have?
- Place the card on the mat and write your reason on a sticky note.
- Compare mats with another group. Discuss any card you placed differently.
- Write your own card about your context: should AI count birds, people or fish?
- Turn your cards into a game for younger students, with an answer card that explains your thinking, not just a right or wrong answer.
How you'll know: For each card you can give a reason that uses accuracy, fairness or context, and your group can explain one case where a person must make the final decision.
Go further: Read about Te Hiku Media's Kaitiakitanga Licence. Add a card about who should control data about a language or a people, and explain your placement.
Fits week 4 →Privacy makeoverHow do you share data so it helps people without harming anyone?Open
You need: Your group's spreadsheet and shared folder · The Privacy Act 2020 principles summary (Privacy Commissioner website) · A 'could this identify someone?' checklist
- Check every column. Could any single value, or two values together, point to one person?
- Remove or combine anything identifying, for example 'Room 12, bikes from Rata Street' becomes 'bikes'.
- Check who the file is shared with. Change it to only the people who need it.
- Make a strong passphrase from four random words and explain why it is harder to guess than 'Password1'.
- Read three of the privacy principles and match each one to something your class did.
- Write your line of the class data promise.
How you'll know: Nobody could be identified from your shared data, the file is shared only with the people who need it, and you can explain one privacy principle in your own words.
Go further: Find out what 'two-step verification' is and why it protects an account even if a password is stolen.
Fits week 5 →Look closer
From the real world
Background reading
Read to understand
Short readings written for Kōkiri Learn students, with their sources.
- Ones, zeros and the data trail you leaveWhat data is, how computers store words and pictures using only on and off, and why metadata matters.
- Finding the true story in a spreadsheetHow to collect fair data, clean it in a spreadsheet, and choose charts that show the truth instead of tricking people.
- How AI learns, and when to trust itAI learns patterns from data, so unfair or missing data makes unfair AI. How to judge when AI is suitable and who should control the data.
Trusted NZ sites
Explore more
Placed at the stage of the journey where each one helps.
Discover
Census ↗Stats NZ
How Aotearoa counts its people, and how census data is used to plan schools, roads and hospitals.
Explore
Binary numbers ↗CS Unplugged (University of Canterbury)
A New Zealand-made set of no-computer activities for learning how binary works.
Explore
Image representation ↗CS Unplugged (University of Canterbury)
Learn how pictures become numbers, with pixel and compression activities.
Sketch
CensusAtSchool – TataurangaKiTeKura ↗CensusAtSchool New Zealand
Real survey data from New Zealand students to explore, clean and chart.
Sketch
New Zealand Garden Bird Survey ↗Manaaki Whenua – Landcare Research
The method and national results for counting backyard birds, to compare with your own.
Improve
Artificial intelligence ↗Science Learning Hub
A clear introduction to how AI and machine learning work, with New Zealand examples.
Improve
Teachable Machine ↗Google
Train your own image model in the browser and see how training data shapes the result.
Improve
AI for Oceans ↗Code.org
Train an AI to sort fish from rubbish and discover how bias creeps in.
Give Value
Spyfish Aotearoa ↗DOC and Wildlife.AI on Zooniverse
Count fish in real marine reserve videos and help train a conservation AI.
Navigate Constraints
Misinformation and fake news ↗Netsafe
How to spot and stop false information before you share it.
Navigate Constraints
Protecting children and young people's privacy ↗Office of the Privacy Commissioner
What the Privacy Act means for data about young people.
Navigate Constraints
Data sovereignty and the Kaitiakitanga Licence ↗Te Hiku Media
How a Māori organisation keeps control of te reo Māori data used to build AI.
Real audiences
- The principal, board or a council road safety officer, who receive the school travel data story and a recommendation
- A local predator-free, Forest & Bird or bird group, who receive the backyard bird data and charts
- A DOC ranger or marine reserve guardian, who hears what the class found about fish counting and AI
- Younger classes, who play the 'AI or not?' card game and give feedback
- Whānau at a data story evening, where students explain their data promise
Work with other schools
- Run the same bird count at the same time as a partner school in a different region (urban and rural, or north and south), share one combined spreadsheet, and compare patterns.
- Swap cleaned datasets with another class: each class makes charts from the other's data and sends back 'Our data shows…' and 'Our data cannot tell us…' statements.
- Build a shared set of 'AI or not?' scenario cards across schools, with each class adding cards from its own context and explaining its placements.
Stretch challenges
- Join the real New Zealand Garden Bird Survey with your whānau in winter and compare your household count with the national results.
- Count and classify fish on Spyfish Aotearoa and write a short report on which fish were hardest to identify, and why that makes AI training harder.
- Collect a second season of data (summer and winter birds, or wet-week and fine-week travel) and make a line chart that shows the change.
- Research Māori data sovereignty and Te Hiku Media's te reo Māori speech technology, and explain to the class why a community might want to control its own data.
- Design a paper prototype of an app screen that asks for data fairly: it says what it collects, why, and gives a clear 'no thanks' button.
New Zealand Curriculum
What this world covers
Mapped to the refreshed Phase 3 statements. The whole class covers both the Year 7 and Year 8 sequences over two years.
Technology · Digital technologies
How data is collected, stored and encoded: binary encodes text, images and sound; file formats and compression affect quality and size; metadata makes content searchable
Year 8 sequence
Technology · Digital technologies
Collecting a small dataset, cleaning it (types, duplicates) and choosing clear visualisations; biased or incomplete training data affects AI; evaluating when AI is suitable, considering accuracy, fairness and context
Year 8 sequence
Technology · Digital technologies
Binary representation and the ethics and choice of digital tools, including privacy and security of personal data
Year 7 sequence
Mathematics and Statistics · Statistics
Statistical enquiry: posing an investigative question, collecting and cleaning data, choosing bar, line and pie displays, and describing patterns, trends and outliers
Year 8 sequence
English · Reading
Evaluating the reliability of digital texts; identifying mis-, dis- and malinformation and cross-checking sources
Year 8 sequence
For teachers: how to run it
Prep: book devices with a spreadsheet tool (Google Sheets, Excel or Numbers) for week 3, and test Teachable Machine and Code.org AI for Oceans on the school network in week 4 (neither needs student accounts). Print CS Unplugged binary cards (five cards per pair: 1, 2, 4, 8, 16 dots) and 10 × 10 pixel grids. Prepare a deliberately messy sample dataset (duplicates, mixed spellings such as 'tui', 'Tūī' and 'TUI', blank cells, a typo of 400 instead of 4) so every group practises cleaning. For the bird context, time the class count to the Garden Bird Survey (late June to early July) if you can, and print a bird identification sheet; for the reef context, pre-select a few Spyfish Aotearoa clips on the Zooniverse site and show them from the teacher's screen. The AI promise: in this world students test, question and judge AI; AI never writes, draws or thinks for them. Any generative AI demonstration is run by the teacher on the projector, within your school's AI policy and the tool's age limits (many require users to be 13 or older). Teachable Machine trains in the browser; have students train it on objects (leaves, recycling, shoes) and never on classmates' faces. Pūkeko asks one question about the dataset each week; it never supplies answers or marks work. Privacy and safety: collect no names, photos of faces or wellbeing information. The travel survey records mode of travel and year level only. Teach the difference between anonymous data and data that could identify someone (a single student who bikes from a named street is identifiable). Outdoor counts need the usual supervision, boundaries and weather checks; stay on paths and away from traffic at the school gate. Delete raw data at the end as the class data promise says. Protocols: birds and fish are taonga species, and data about Māori people, land and taonga carries responsibilities. Introduce Māori data sovereignty through Te Hiku Media's Kaitiakitanga Licence, and talk with your school's iwi relationships or mana whenua if your data concerns a local awa, reserve or rohe moana. Name marine reserves correctly and do not speak for mana whenua. Differentiation: give a partly built spreadsheet with column headings and one formula to students who need it; confident students add COUNTIF, AVERAGE, conditional formatting and a pivot table, or compare local data with Garden Bird Survey or CensusAtSchool data. Pair strong readers with others for the readings, and let students present their data story as a poster, slides or a short spoken talk. Links: this world connects with Kōkiri Lab's Robotics & Systems (sensors collect data) and Worldbuilding & Navigation (algorithms in Scratch), and follows on from Code a Game, where students met binary and algorithms. Pair it with a maths statistics unit: the statistical enquiry cycle runs through weeks 2–4.
Plan this world into any term with the two-year planner. Students can record their thinking in their Kōkiri Learn portfolio.
More Technology worlds


Ready to run it with your class?
Free trial for NZ schools. One combined Years 7–8 class, any term.